Table of Contents
MF3d/E+ via Getty Images
Written by Nick Ackerman, co-produced by Stanford Chemist
As an income investor, I’m typically drawn to areas where there are reliable cash flows that remain consistent. Two areas where that is often happening are in the real estate and utility sector space. Most often, when we think of “real estate” closed-end funds, they are mostly holding real estate investment trusts (“REITs”).
REITs have been delivering a solid amount of payouts to investors since the structure was created. This goes all the way back to 1960. Gone are the days when you have to actively manage your own real estate empire of physical buildings. Let an expert team do it for you.
Real estate investment trusts (“REITs”) have been around for more than fifty years. Congress established REITs in 1960 to allow individual investors to invest in large-scale, income-producing real estate. REITs provide a way for individual investors to earn a share of the income produced through commercial real estate ownership – without actually having to go out and buy commercial real estate.
In the closed-end fund space, we can go even more passive. Let the managers determine which REIT might be best to invest in. Though I own several real estate funds, I admit that I also enjoy picking my own REIT investments and doing some research into them.
One of the reasons that REITs have consistent and regular payouts that are often higher than other securities is their structure. The REIT structure says that at least 90% of their taxable income must be distributed to shareholders annually. Well, this fits perfectly well with regulated investment company (“RIC”) CEFs themselves as they too must distribute out the majority of their earnings. That includes income and gains.
So, while the managers are buying and selling – if they are successful – investors get a piece of that pie too. They are often leveraged, which is true in the CEF real estate space as all but one of the funds here employ leverage. There is only a small handful of funds that focus exclusively on REITs overall, so the basket is small.
I wouldn’t complain if some new ones made it to the market. Cohen & Steers is often regarded as one of the best real estate fund sponsor choices. They have a new real estate fund in the works that will hopefully make it to market before too long.
Equity REITs performed incredibly well in 2021, but not only that, they have been strong performers going back for over a decade now. Hoya Capital, in a previous article, had noted this interesting fact; “REITs are now the fourth best-performing asset classes since the start of 2010, producing average annual total returns during this time of 13.5%, producing superior total returns to Bonds (AGG), TIPS (TIP), Commodities (DJP), Emerging Markets (EEM), and International (EFA) stocks.”
For all these reasons, that’s why I believe the real estate CEFs are worth taking a look at and reviewing periodically.
The Screening And Basic Data
Data from CEFConnect as of 2/4/2022
| Name | Ticker | Premium/Discount | 52 Wk Avg | Distribution Rate | Effective Leverage | Baseline Expense | 5-Year NAV | 10-Year NAV | 5-Year Price | 10-Year Price |
| Aberdeen Global Premier Properties | (AWP) | -6.32% | -5.29% | 7.89% | 16.16% | 1.19% | 9.33 | 7.79 | 12.75 | 9.96 |
| CBRE Global Real Estate Income | (IGR) | -9.56% | -8.38% | 7.05% | 20.39% | 1.26% | 9.58 | 7.95 | 12.06 | 9.24 |
| Cohen & Steers Qual Inc Realty | (RQI) | -1.22% | -2.60% | 5.91% | 23.34% | 1.30% | 12.37 | 12.63 | 13.49 | 13.96 |
| Cohen & Steers REIT & Preferred Inc Fd | (RNP) | -2.94% | -2.04% | 6.26% | 24.94% | 1.04% | 11.56 | 12.31 | 13.51 | 13.4 |
| Cohen & Steers Total Return | (RFI) | 6.54% | 6.50% | 6.02% | 1.52% | 0.88% | 10.72 | 10.43 | 12.52 | 10.94 |
| Neuberger Real Estate Securities Income | (NRO) | -4.18% | -3.41% | 7.78% | 22.72% | 1.21% | 6.86 | 8.45 | 8.56 | 10.42 |
| Nuveen Real Estate Income | (JRS) | -6.35% | -6.85% | 6.69% | 29.12% | 1.30% | 9.67 | 10.42 | 9.09 | 9.2 |
| Principal Real Estate Income Fund | (PGZ) | -10.09% | -12.74% | 6.77% | 29.86% | 2.15% | 5.45 | 6.24 |
Above, we can see the 8 funds that are identified as “real estate” by CEFConnect. I’ve included the name, ticker, premium/discount, 52-week average discount, distribution rate, effective leverage and baseline expenses. In addition to those important metrics, I’ve also included the 5- and 10-year total NAV and share price returns if they were available.
A few observations:
- Average discount of the list is 4.27%
- Average 1-year discount is similar at 4.35%
- Average distribution yield of these funds comes to a healthy 6.8%
- Effective leverage employed comes to 21.01%, with RFI essentially having none
- Average expense ratio comes to 1.29%
- 5-year average NAV annualized returns come to 9.44%, compared to share price annualized returns of 11.03%
- 10-year average NAV annualized returns come to 10%, compared to the share price annualized returns of 11.01% (PGZ hasn’t been around long enough to provide figures here)
Here are some basic facts on Vanguard Real Estate ETF (VNQ), which is frequently compared to these CEF peers.
- 0.12% expense ratio
- 2.82% yield
- 5-year annualized return 9.36%
- 10-year annualized return 9.86%
- focused on U.S.-based REITs
- $39.64 billion AUM
I’ve written on several of these names in the past, or others have on Seeking Alpha. Therefore, I’m going to skip out on the basic introduction of the funds and going to assume a baseline understanding. Instead, I want this article to focus on similarities and differences between the funds and provide us with a snapshot of the important metrics.
IGR and AWP
While these funds are from different sponsors, they have a unique characteristic of focusing on global real estate. That’s why I’ve covered them in the past at the same time. However, I more recently updated my views on IGR.
The longer-term performance from these funds is the weakest of the bunch. This is generally seen as being the case due to their global tilting. We all know that the U.S. market has outperformed its global counterparts by far. This appears to have translated over into the REIT space as well.
At the same time, IGR has been able to slightly edge out AWP in both the last 5 and 10 years on a total NAV return basis. Yet, AWP has slightly outperformed on a share price basis in those same periods.
That has created a situation where IGR trades at a deeper discount. This has historically been the case as well if we look over the 5- and 10-year average. One of the main allures, which I believe contributes to this, is that AWP is carrying a higher distribution yield. That tends to draw folks into the funds.
Looking back over the last 10 years, AWP has consistently paid out a higher rate than IGR. That reinforces why the longer-term discount of IGR could be deeper relative to AWP. These yields came closer through the Covid-induced panic selling period of 2020.
Ycharts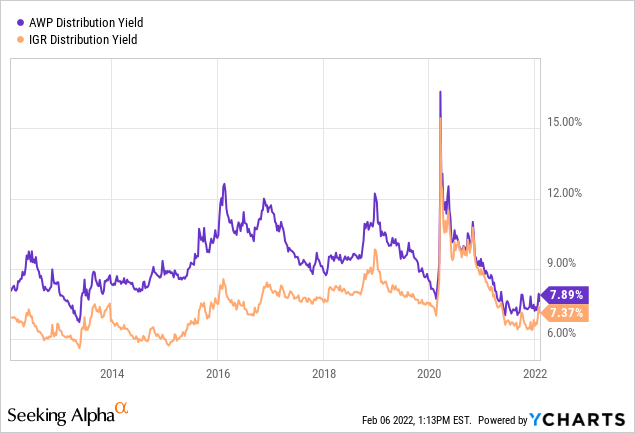
RQI, RNP, and RFI
RQI, RNP, and RFI are the powerful triplex offered by Cohen & Steers (CNS) funds. This is a real asset-focused fund sponsor, and they have been crushing it in the REIT space. I hope a fourth CEF offering doesn’t destabilize this three-legged stool.
These three funds represent the best CEFs in the space. They have outperformed their VNQ counterpart by quite a sizeable lead. Helping that was the use of leverage. Which we can see play out in the total returns when you compare RFI to sisters RQI and RNP. RQI and RNP have outperformed RFI on a 5- and 10-year basis. I suspect a lot of that has to do with the leverage.
Overall, RFI and RQI have the most similarities in that they invest mostly in equity REITs with some preferred and bond exposure. In contrast, RNP goes heavier into preferred shares than those two at around a 44% allocation. RQI at about 7% and RFI at roughly 9%.
Despite this, RFI has been the one leading in terms of valuation. This fund has consistently traded at a premium over the last few years. There was a period between 2014 and 2017 where a discount was persistent. Before that, however, it was at a regular premium once again.
Ycharts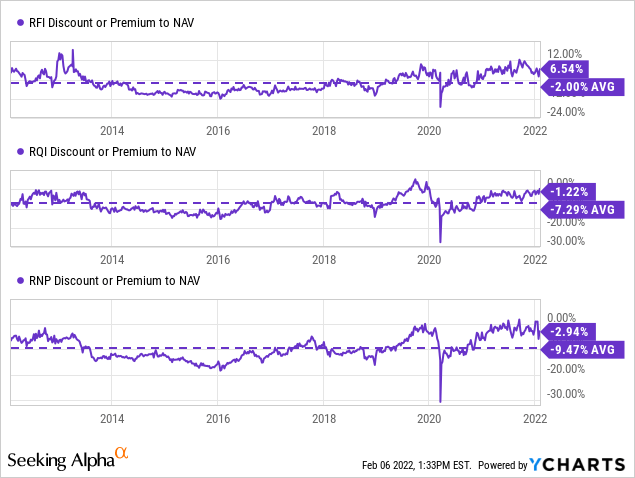
The one thing I noticed between these funds is that RFI and RQI often carry a similar distribution yield, despite RQI’s leverage. In fact, over the last 10 years, RFI has averaged an even higher rate than RQI. I surmise that investors look at these two similar funds and go with the one that doesn’t incorporate leverage but still provides a comparable yield.
Ycharts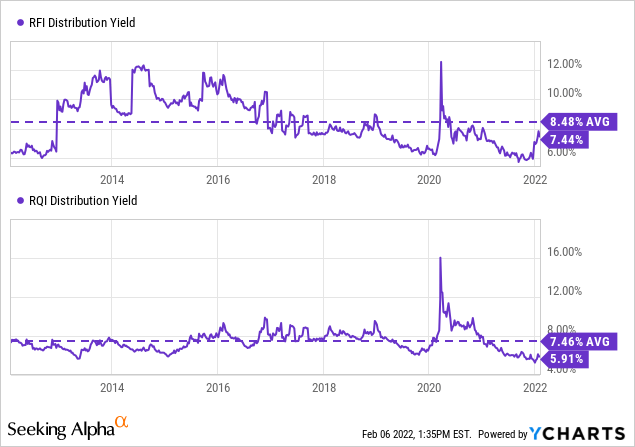
These funds have focused heavily on U.S.-based investments. That’s what has seen them outperform the IGR/AWP peers. At the same time, they’ve also focused more towards “growth-oriented” REITs to a more significant degree. Those include names such as American Tower Corp (AMT), Prologis (PLD) and Equinix (EQIX), to name a few. These are generally lower-yielding REITs but are those that are experiencing higher growth.
NRO
NRO is a fund I’ve held in the past and would consider owning again in the future. NRO can be viewed as more similar to RNP in that it incorporates a fairly hefty allocation to preferred outside of the equity REIT focus. Their Annual Report shows 87.2% in common stocks and 39.6% in preferred.
When this fund drops to near a 10% discount, I start getting excited.
That happened to occur at the start of 2021 when they announced a distribution cut for shareholders. The fund swiftly dropped to an almost 9% discount on January 6th. The universe was trying to give me a birthday present, but I ended up buying it on the 4th of that month when it closed at an 8.51% discount.
I proceeded to collect several distributions before making a sale on August 3, 2021, when it reduced its discount to 0.97%. Though the day before, it closed at a premium, so it missed out on even better gains by a day.
When I make a purchase, I often like to think that a position could be a great long-term fit in my portfolio. So, I wouldn’t have minded holding NRO for longer, but with how volatile the fund has been over the last several years in terms of discount/premium, I feel that presents an opportunity on its own.
Ycharts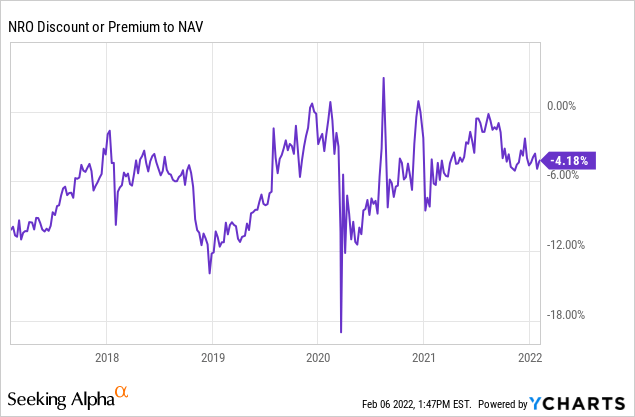
It has been among the weakest performers in this space, even worse than the global funds. That being said, it remains one of the highest-yielding, too – and that is likely continuing to draw investors in.
On a side note, navigating their website is incredibly frustrating and difficult. The latest error – after jumping through hurdles to get to the main page for NRO – is presenting me with this message; “The link you are trying to access is not available in United States. It is available in Spain.”
JRS
JRS is another long-term holding of mine. It has performed admirably but has lagged the C&S funds. It has lagged RFI while being leveraged, so that’s saying a lot there too. One of the reasons for this is that they focus more on value than growth. I’ve covered that more in the past, So while I consider the fund attractive, I think it also has additional risks that one should be aware of. In 2020, they also deleveraged, which certainly didn’t help things when rebounding.
It combines a more attractive discount while providing reasonable results and distribution yield. However, it pays quarterly, which is likely to keep some income investors away. Most income investors enjoy the consistency of monthly distributions. They were also consistently changing the quarterly payout from 2007 to 2019. So far, they’ve kept the $0.19 in place for the last couple of years.
JRS Distribution History (CEFConnect)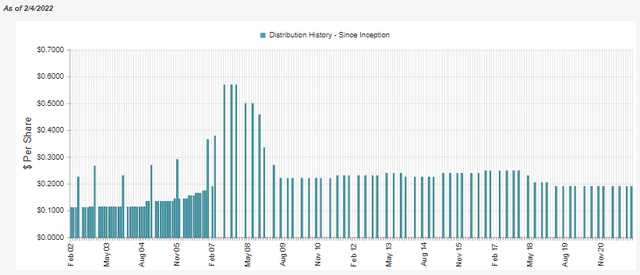
JRS is a bit similar to RNP/NRO in that they incorporate a meaningful allocation to preferred and other fixed-income assets. Common stocks make up around 66% of the fund, with 26.7% in various preferred offerings. Then another 3.3% in bonds, holding cash and equivalents of 4.4% at the time of writing and “net other assets” of 4.7%.
PGZ
PGZ is indeed the black sheep of this list with how different it operates. It isn’t an equity fund or investing in preferred as the others are on this list. In fact, I thought about removing this fund because it is so different. That being said, this fund invests in commercial mortgage-backed securities. Stanford Chemist has covered this fund several times in the past, with the most recent being in February of 2021.
As is evident from the fund’s performance, CMBS has not been a solid place to invest relative to the equity and preferred REIT space. The fund launched in 2013, so we only have the 5 year annualized returns for comparison above. The 3-year returns were even uglier though if you can believe it.
Ycharts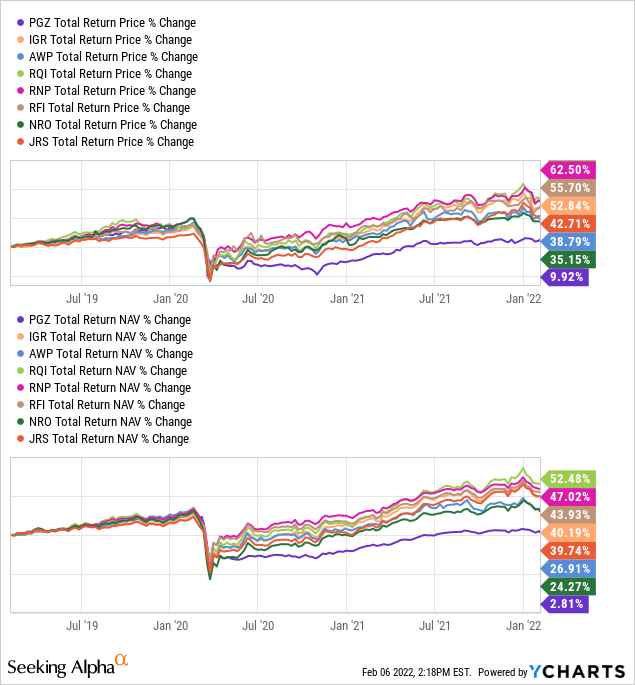
The bright spot, if you can call it that, is that the fund suffered so much in 2020, and that’s why if we are looking at these sorts of returns, we see such abysmal results. When looking at other periods, we can see below that the fund has come in at the middle of the pack. The chart below reflects performance from PGZ’s inception date of June 26th, 2013, to February 19th, 2020. That shows us the performance right before the fund’s collapse.
Ycharts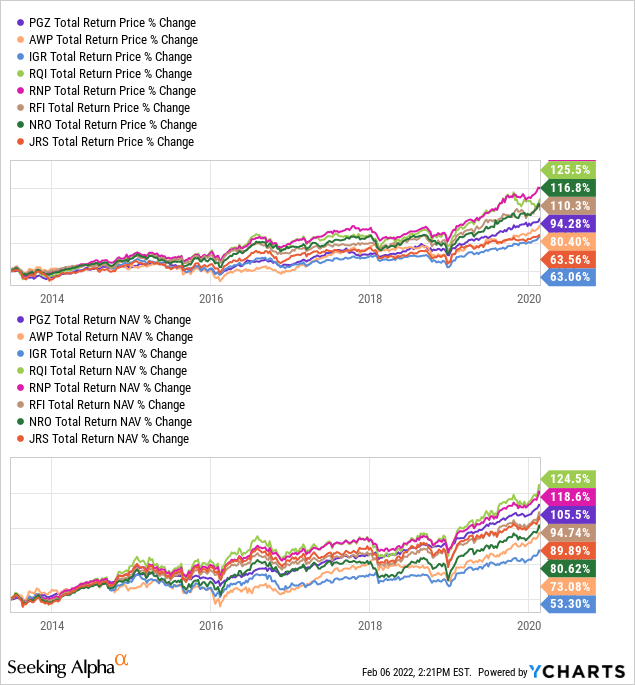
The other thing that would be noted is that comparing to these funds is questionable. As I mentioned, I almost omitted PGZ because of how different it was.
Over the last year, they have provided a total NAV return of 19.27%. Compared to iShares CMBS ETF (CMBS), that’s an actual blowout as that ETF has returned -3.09% over the last year. Though again, it isn’t a perfect comparison to CMBS either as it is a really hybrid structure. That makes it hard to classify. Here are the allocations as of November 30th, 2021.
PGZ Portfolio Allocations (Principal)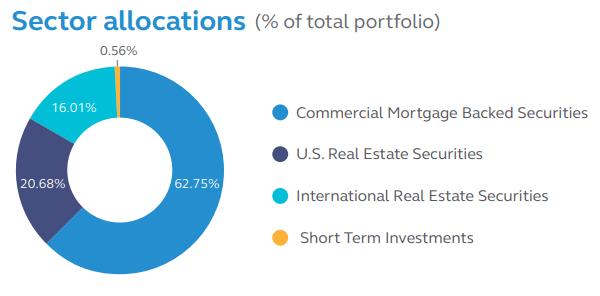
So take all of these performance comparisons on PGZ with a grain of salt.
Conclusion
Real estate has been a strong performing area to invest in over the years. These assets can be incredibly beneficial for retired investors or really any investor with an income focus. In the closed-end fund space, a few gems can really enhance one’s ownership of this valuable area of the market.